The observations have to do with the use of data sampling and Fourier analysis. By sampling dynamic phenomena (sensing, for example) and applying Fourier analysis, one attempts to determine the major oscillatory phenomena underlying the signals generated by a complex system. Jacques Fourier, in one of the most brilliant discoveries of modern mathematics, showed that any periodic function can be expressed uniquely by an infinite sum (i.e., and infinite series) of basic periodic functions, the familiar sines and cosine functions we all learned in high school trigonometry. Moreover, this decomposition into sines and cosines applies to all functions defined on a finite interval, as long as we treat the function as if it were periodic in the sense that whatever pattern it illustrates on the finite interval is assumed to repeat indefinitely.
Note the bold italics! They are the crux of the matter. In other words, we can apply Fourier analysis to any function over a limited interval, if we pretend it is periodic with period defined by the length of that interval. In other words, it only truly applies to periodic functions. The image below illustrates a typical periodic function.

Any piece of an arbitrary, non-periodic function can be isolated and then turned into a periodic function for purposes of Fourier analysis. And this is precisely what is done every time we apply Fourier analysis.
There are inherent limitations in using this technique. When trying to apply this technique to understanding the functions at work in the world (in climate phenomena, e.g.), we are restricted of course to that interval of time during which we have reliable data. And that is a very short time interval since the formation of the world about 4.5 billion years ago. We have some temperature data going back a few centuries, but the quality of that data gets worse the farther we go back and before the 16th century, e.g., it is not very reliable at all. We try to substitute proxies (such as tree ring growth) and that is all well and good, but these things are usually indicators of more than just temperature. So the data records gets fuzzy and the uncertainty certainly grows.
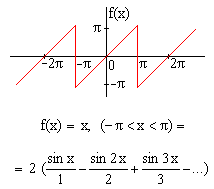
Take a look at the image above. The function is just the line y=x that rises indefinitely at 45 degrees. However, when we restrict our attention to the interval from -pi to +pi and pretend that it is periodic with period determined by this interval, we get a sawtooth pattern. Thus, the Fourier series really only tells about the periodicity present in this repeated pattern. It tells us nothing about what the graph really looks like outside this interval. There could be other long-term periodicities at play outside the interval of interest but the Fourier series is the same for all functions that agree with this one on the chosen interval.
Thus we have a fundamental problem in determining the true frequency content (i.e., the true periodic nature) of physical phenomena at work when we are necessarily limited to a very short observation window. In fact, the rise in the function depicted could in fact be just a tiny segment of a much larger sine wave about which we have no information because our Fourier analysis assumes that the function is periodic with period determined by the interval.
Engineers know this very well. There are always tradeoffs between frequency and time resolution imposed by short window Fourier transforms. The Nyquist theorem states that you have to sample a signal at twice the frequency of the highest frequency present in order to see, i.e., faithfully reconstruct that frequency content. This is the fundamental theorem and reality of communications engineering. Also, to see the low frequencies present, you have to sample accurately for a long time.
With regards to climate data, we have not been sampling accurately for a very long time. If the earth is approximately 5 billion years old and we have been sampling climate data accurately for 500 years (being generous), we have observed a window of time about 0.0000001 or 0.0001%, 1/10,000th of a percent of the true age of the earth. Such an interval is completely unreliable for predicting 1,000-year periodic phenomena, not to mention any larger possible periods.
I am not saying that one should not be concerned about the warming properties of greenhouse gases. There are some, like methane, that are very potent potential contributors to temperature increase. But the contribution of our own C02 is extremely miniscule compared to the contributions of other phenomena, and we have only become aware of a small fraction of the natural phenomena, owing to the limited amount of time we have been looking at the phenomena. Yes, C02 contributes to global warming. But so does rubbing my hands together.
No comments:
Post a Comment